Executive Summary
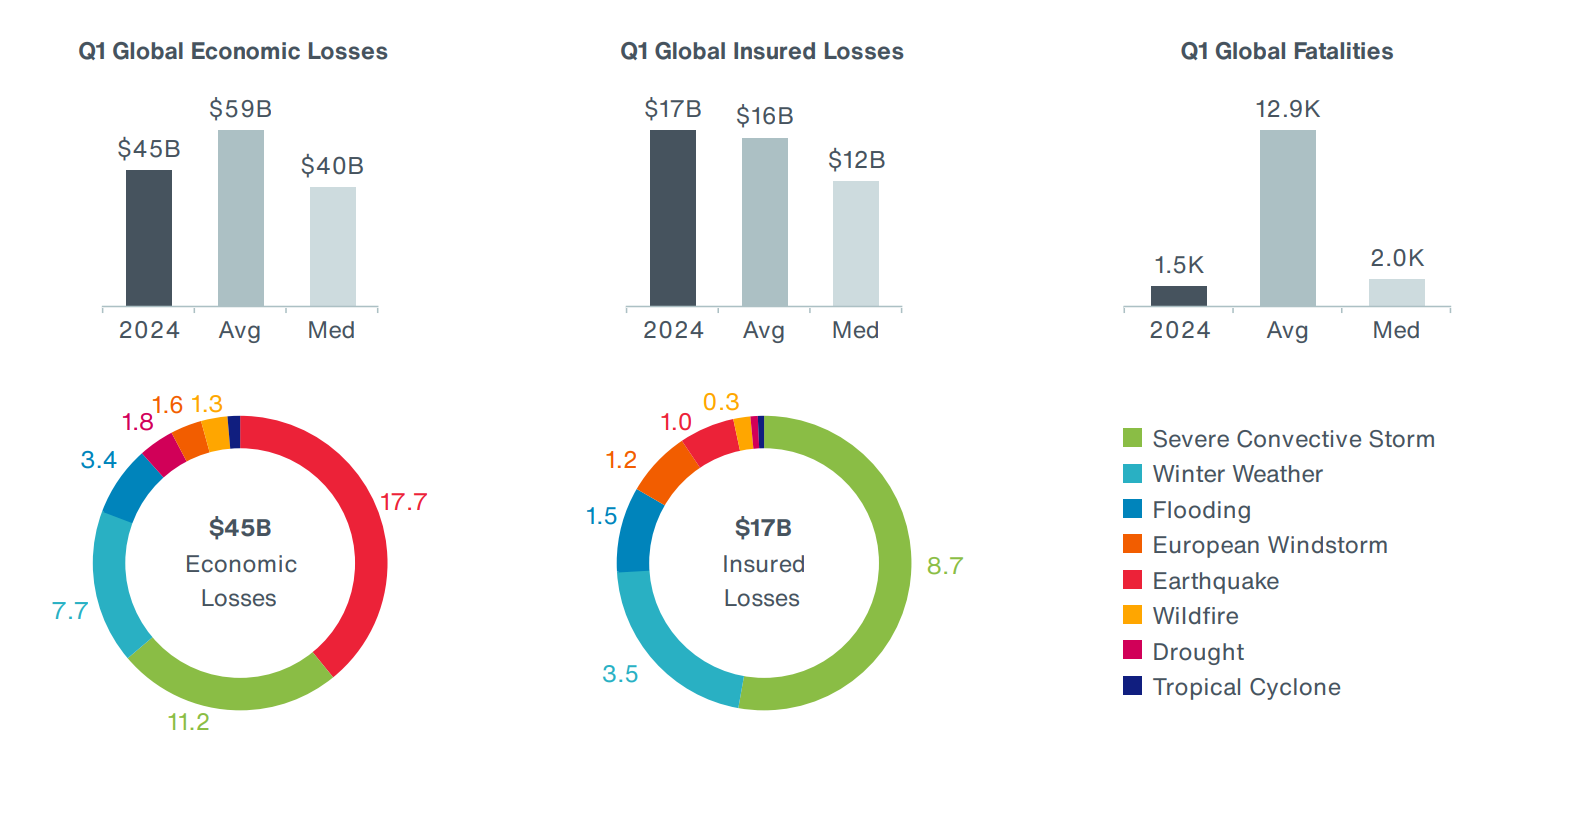
The first quarter of 2024 saw several notable disaster events, which drove total year-to-date economic losses above $45 billion. This was lower than the 21st-century Q1 average of $59 billion and significantly lower than losses in the first quarter of 2023 ($149 billion). The costliest event of the first three months was the Noto Earthquake in Japan, which occurred on the very first day of the year and resulted in economic losses of $17.6 billion, according to governmental estimates. Insured losses reached at least $17 billion and were slightly above the average. Among the major loss drivers were severe convective and winter storms in the United States, as well as windstorms and flooding in Europe, and the earthquake in Japan. It is worth noting that these estimates are expected to evolve and should be considered preliminary. The insurance protection gap for the first quarter can be estimated at 64 percent. While earthquake became the costliest peril of the first quarter from the economic loss perspective as a consequence of the Noto event in Japan, severe convective storms and winter storms drove insured losses due to higher insurance coverage of such events, particularly in the United States. More than 1,500 people were killed globally, which is significantly lower than the long-term average. The deadliest event was the Noto earthquake with 245 killed, followed by flooding in the DRC and Congo in January (240) and the devastating Chile wildfires in February (131). With persisting extreme anomalies of ocean temperatures and La Niña conditions expected to develop later in the year, the latest forecasts for the upcoming hurricane season in the North Atlantic suggest extremely high activity, with an average number of 11 hurricanes.

Economic Losses Significantly Lower than Last Year
Global economic losses due to natural disasters in the first quarter of 2024 were preliminarily estimated at $45 billion, nearly 50 percent higher than the long-term mean, but 20 percent lower than the recent decadal average since 2014 ($55 billion). The number of billion-dollar events was 12, eight of which occurred in the United States, two in South America, and two in Asia. It is worth noting that these numbers are subject to change as individual event loss estimates tend to evolve even months after the date of occurrence.
EXHIBIT 1: Q1 Global Economic Losses from Natural Disasters
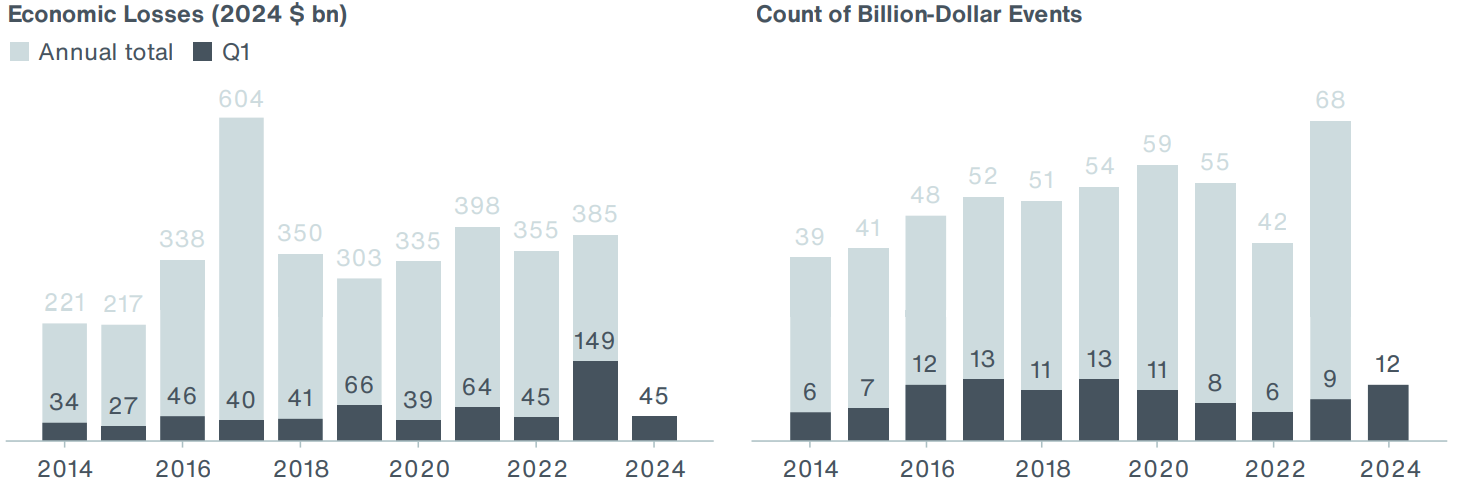
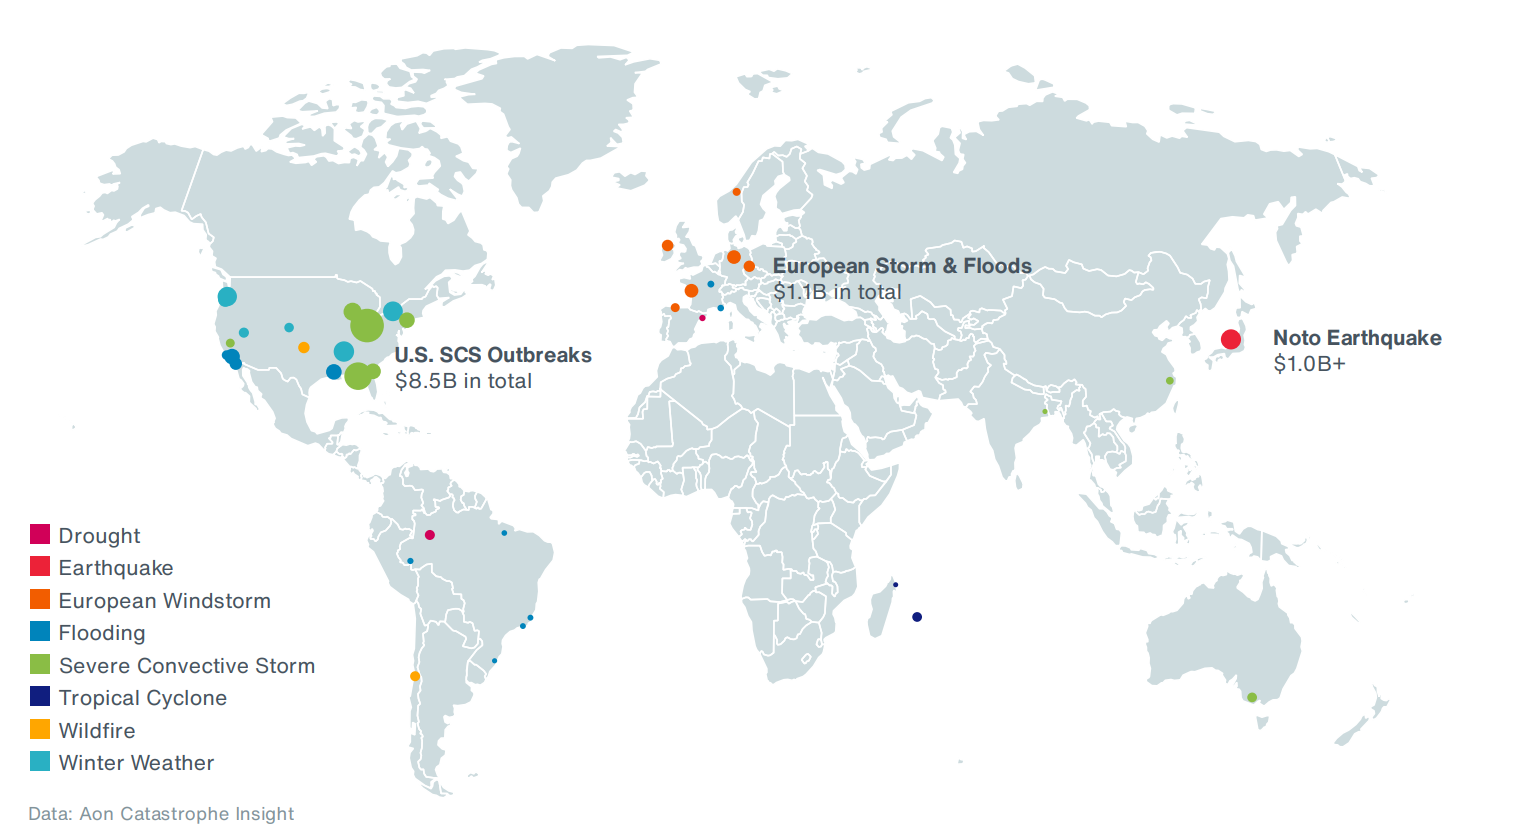
EXHIBIT 2: Q1 2024 Economic Loss Events
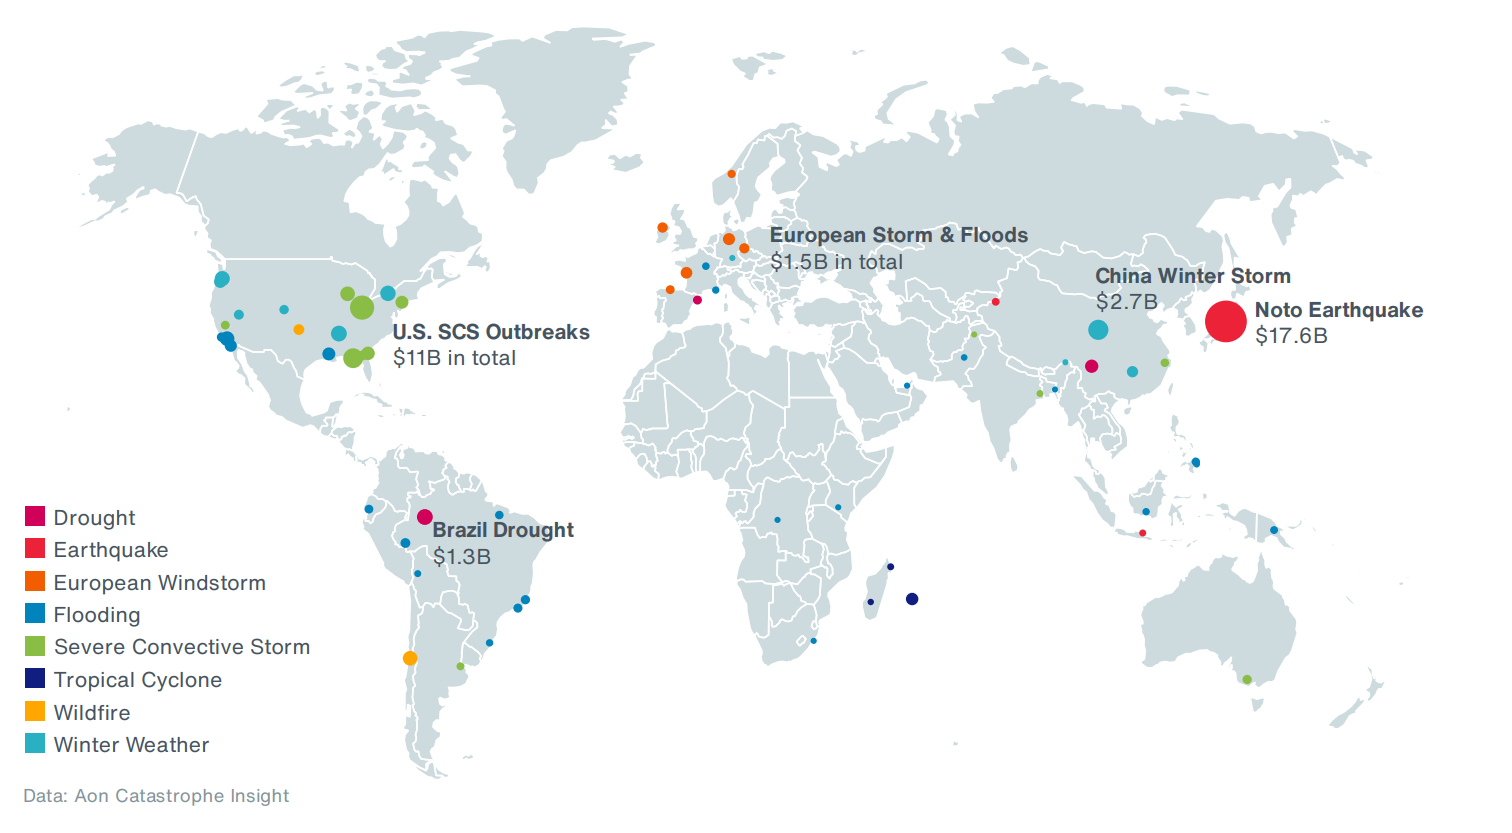
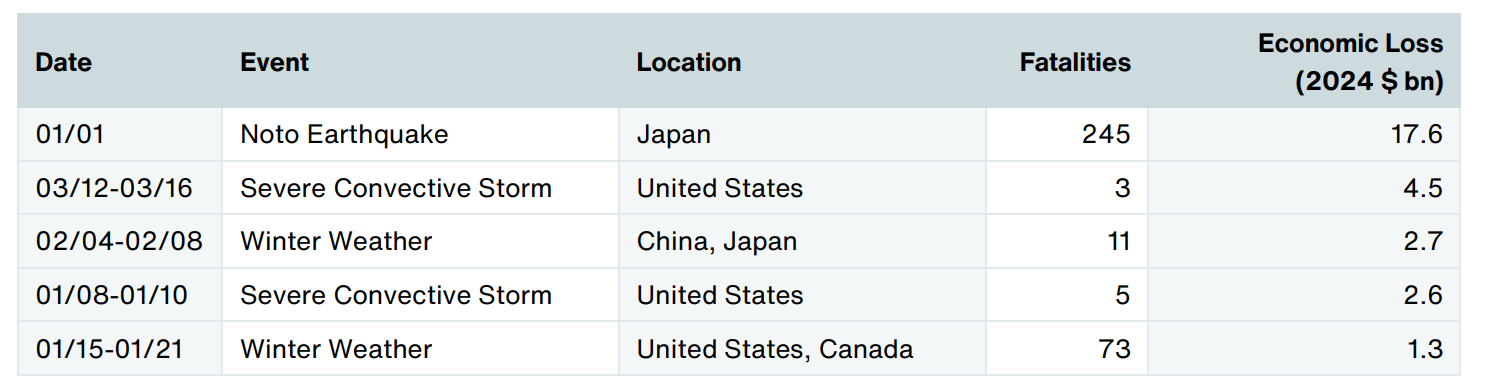
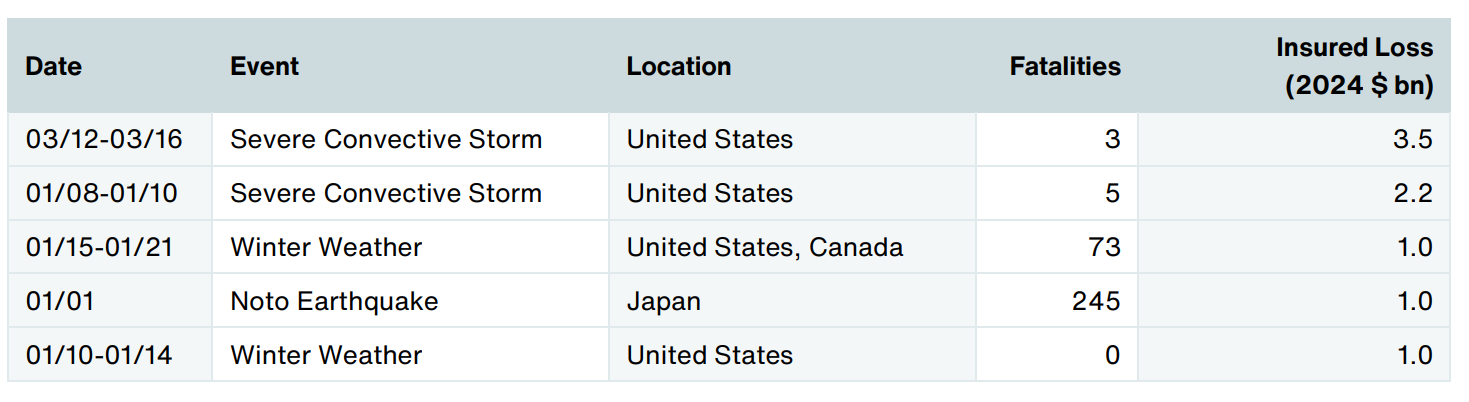
The costliest event of the first quarter was the Noto earthquake, which hit Japan on January 1 and generated over $17 billion of losses, based on preliminary governmental estimates. It is followed by the extensive severe convective storm outbreak that impacted parts of the United States in mid-March. Among the costliest events was also a winter weather event that predominantly impacted China in early February.
EXHIBIT 3: Top 5 Costliest Economic Loss Events in Q1 2024
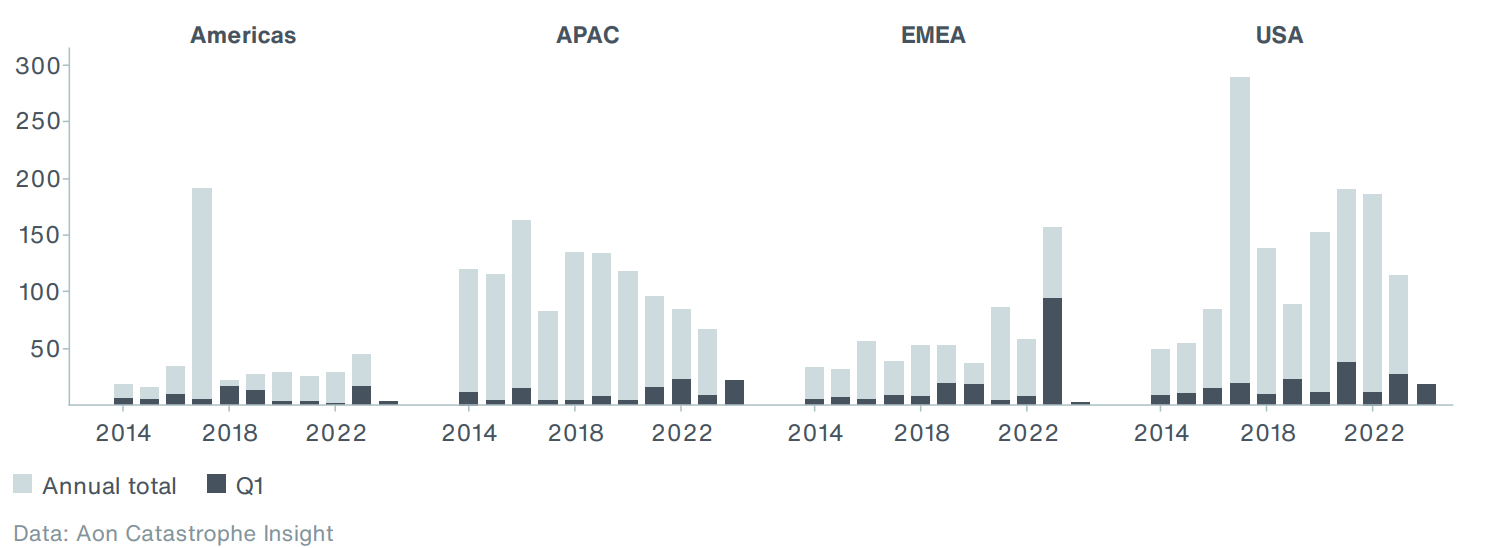
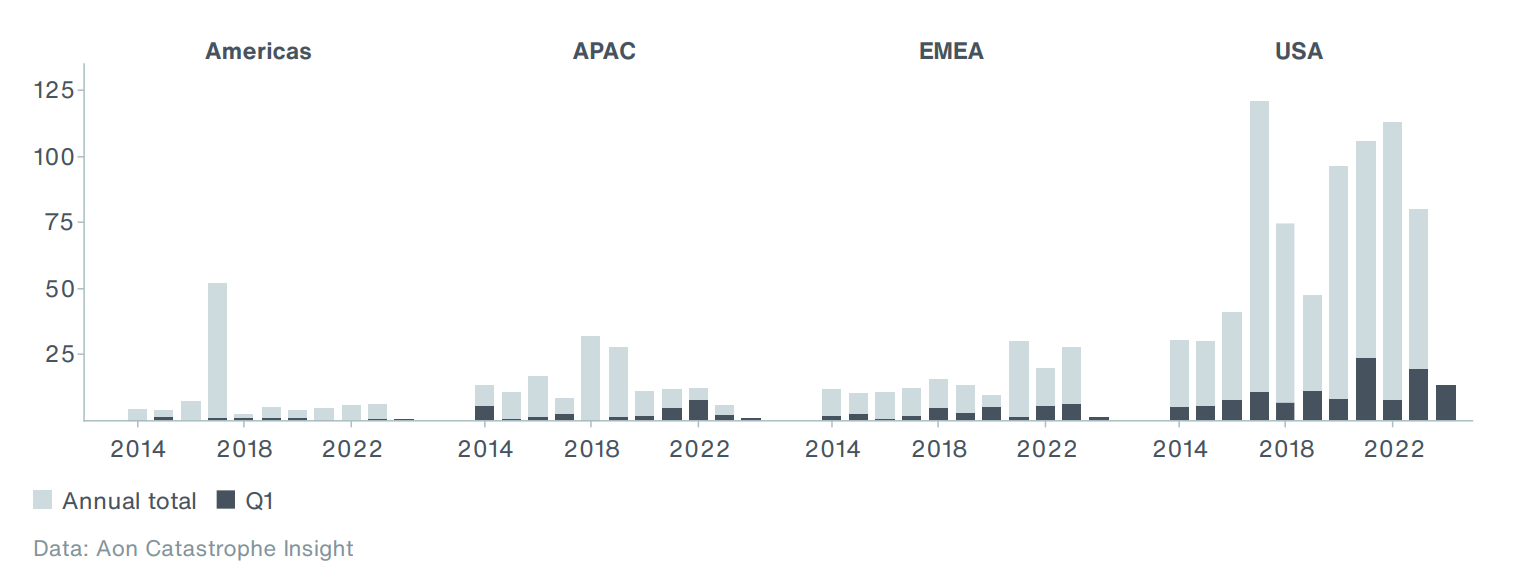
From a regional perspective, the APAC region accounted for the largest portion of global economic losses with a current preliminary estimate of $20 billion, largely driven by the Noto event. In contrast with the previous year, which saw the devastating earthquakes in Turkey and Syria with exceptional losses, Q1 2024 in the EMEA region only recorded roughly $2 billion in economic losses. Losses in the Americas were also close to average, with the largest losses coming from the ongoing drought in Brazil. Similarly, losses in the United States in Q1 were comparable to previous years and were mainly driven by severe convective storms.
EXHIBIT 4: Q1 Economic Losses by Region (2024 $ bn)
Insured Losses Driven by SCS and Winter Storms
Global insured losses from natural disaster events in the first quarter of 2024 are estimated to reach at least $17 billion, which was close to the average since 2000 ($16 billion) and notably higher than the median ($12 billion) for the period. It is a significant drop from the exceptional losses in Q1 of 2023, which were driven by the elevated SCS activity in the United States. There were at least four billiondollar events. Due to expected loss development, additional events might cross the threshold.
EXHIBIT 5: Q1 Global Insured Losses
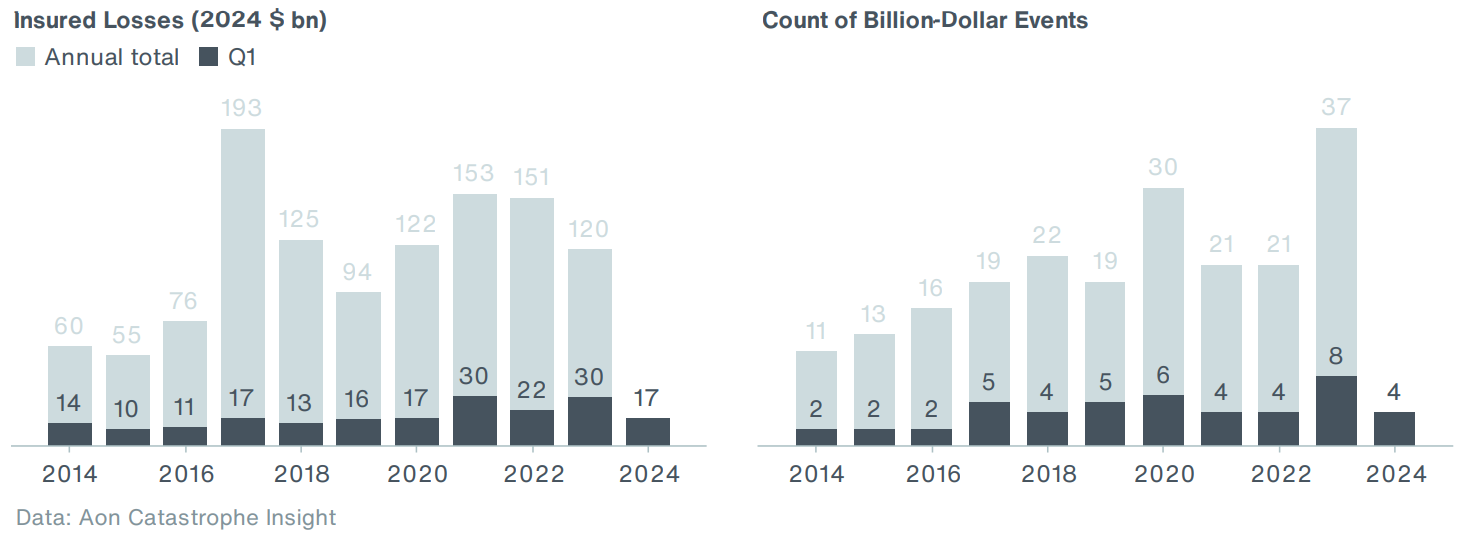
EXHIBIT 6: Q1 2024 Insured Loss Events
Severe convective storms and winter weather events in the United States generated most of the global insured losses in the first quarter. The total loss from the Noto event in Japan is still preliminary and expected to evolve but might exceed the $1 billion mark.
EXHIBIT 7: Top 5 Costliest Insured Loss Events in Q1 2024
Disaster events in the United States accounted for roughly three-quarters of global insured losses in Q1- Q3 of 2023, reaching more than $13 billion. This was nearly twice as high as the long-term average for the first quarter. All the other regions recorded under-average insured losses in Q1 2024.
EXHIBIT 8: Q1 Insured Losses by Region (2024 $ bn)
Noto Earthquake Claims Continue to Evolve
Overview
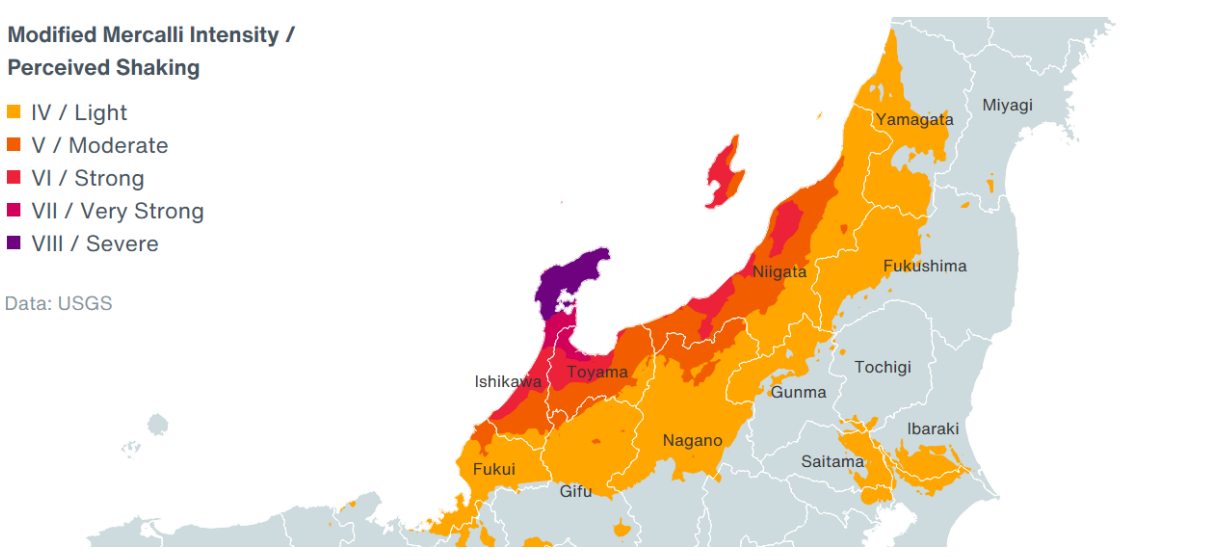
On the very first day of 2024, a magnitude-7.5 earthquake struck the Noto Peninsula in Japan, 300 km (186 mi) northwest of Tokyo. The main shock and nearly 8,600 aftershocks of varying intensity that followed impacted a large part of J ' west coast, affecting millions of people. This was one of the largest crustal earthquakes impacting mainland Japan in the past 100 years. However, it took place in a region with a relatively lower population and exposure density. Insured losses from the event will continue to evolve.
EXHIBIT 9: Noto Earthquake Intensity
Loss Estimates and Impact on Re/insurance
Despite Japan's ability to design and build earthquake-resistant infrastructure, the event claimed at least 245 lives and 1,546 injuries. In addition to these casualties, the event caused significant material damage and already ranks as the seventh-largest earthquake in modern Japanese history in terms of the number of damaged dwellings. According to the latest figures published by the General Insurance Association of Japan (GIAJ1 ), the event resulted in at least ¥74 billion ($480 million) of insured losses on dwelling risks (as of 31 March 2024), with approximately 81,500 insurance claims paid and an average claim of $5,900. It is important to note that the region that was impacted has a relatively higher proportion of senior citizens (~60 percent was aged over 60 compared to ~30 percent nationally), which impacts number of fatalities and injuries. Another important point to consider is that Japan has undergone a series of building code updates reflecting the lessons from earthquakes, with the most prominent change made in 1981 (1981 Standard2 ). The seriously impacted region had double the amount of pre-1982 housing compared with the national average proportion-wise, which naturally impacts the extent of damage. Moreover, the seismic retrofitting in the region is well below the national standards.
EXHIBIT 10: Insured Losses For Dwelling Risks By Prefecture According To GIAJ as of March 31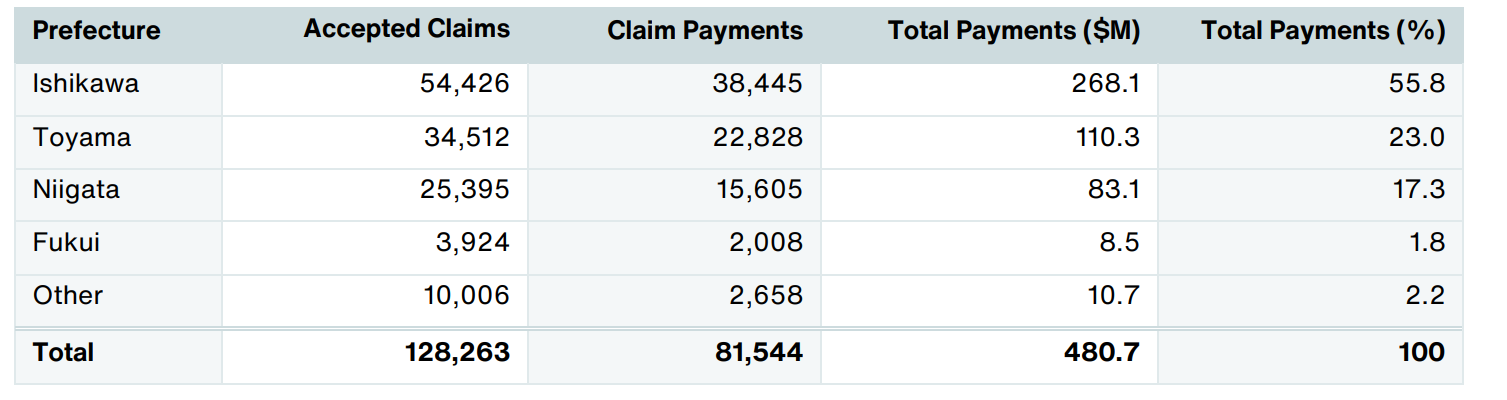
Payouts remain ongoing and the total insured loss from GIAJ is tentatively expected to exceed ¥100 billion ($660 million). Total insured losses will be even higher as GIAJ operates in less than 50 percent of the Japanese insurance market, depending on the region. For example, in Ishikawa Prefecture, which was most affected by the earthquake, G J' penetration rates are approximately 30 percent. This is followed by Niigata and Toyama prefectures with 27 percent and Fukui with around 35 percent. It should also be noted that these figures represent only residential lines, but not commercial and industrial. According to data from GIAJ, by far the highest loss was recorded in Ishikawa prefecture ($268 million), which lies partially on the fault rupture plane of the earthquake. This equals more than half of the losses reported by GIAJ. A quarter of the payments were reported in Toyama prefecture ($110 million) and $83 million were registered in Niigata. A larger average payout is expected in the Ishikawa prefecture compared to other regions due to close proximity to the fault plane, along with a higher proportion of older homes.
Historical Context
Comparison with other historical events reveals that the Noto earthquake is among the costliest events since 1950, yet not anywhere close to the impact of the Great Tohoku Earthquake and Tsunami in 2011, or the Great Hansin event in 1995.
EXHIBIT 11: Costliest Earthquakes in Japan Since 1950
Active U.S. Winter: High Losses & Wildfire Activity
Overview
A fairly active weather pattern featuring several winter storms, severe weather outbreaks and flooding events took place during Q1 in the United States. Despite recording the warmest winter on record for the U.S., a substantial cold air outbreak and winter weather pattern spread across much of the lower 48 states in mid-January, which claimed over 70 lives. Q1 was highlighted by losses well above the 21st - century average and notable events such as the Smokehouse Creek Fire – the largest in Texas history, yet notably below the exceptional losses experienced in Q1 of 2023.
Notable Events
Insured losses from severe convective storms, winter weather and flooding across the United States in Q1 2024 were preliminarily estimated at nearly $13 billion, well above the 21st -century average of nearly $7 billion. Both figures are significantly less compared to Q1 insured losses from last year (above $19 billion), which featured several costly SCS events. Similar to 2023, the costliest Q1 2024 insured loss event in the U.S. also came from a severe weather event. Widespread large hail and multiple violent tornadoes from the south-central Great Plains to Ohio generated losses preliminarily estimated at $3.4 billion.
EXHIBIT 12: Historical and 2024 Wildfire Perimeters in Texas
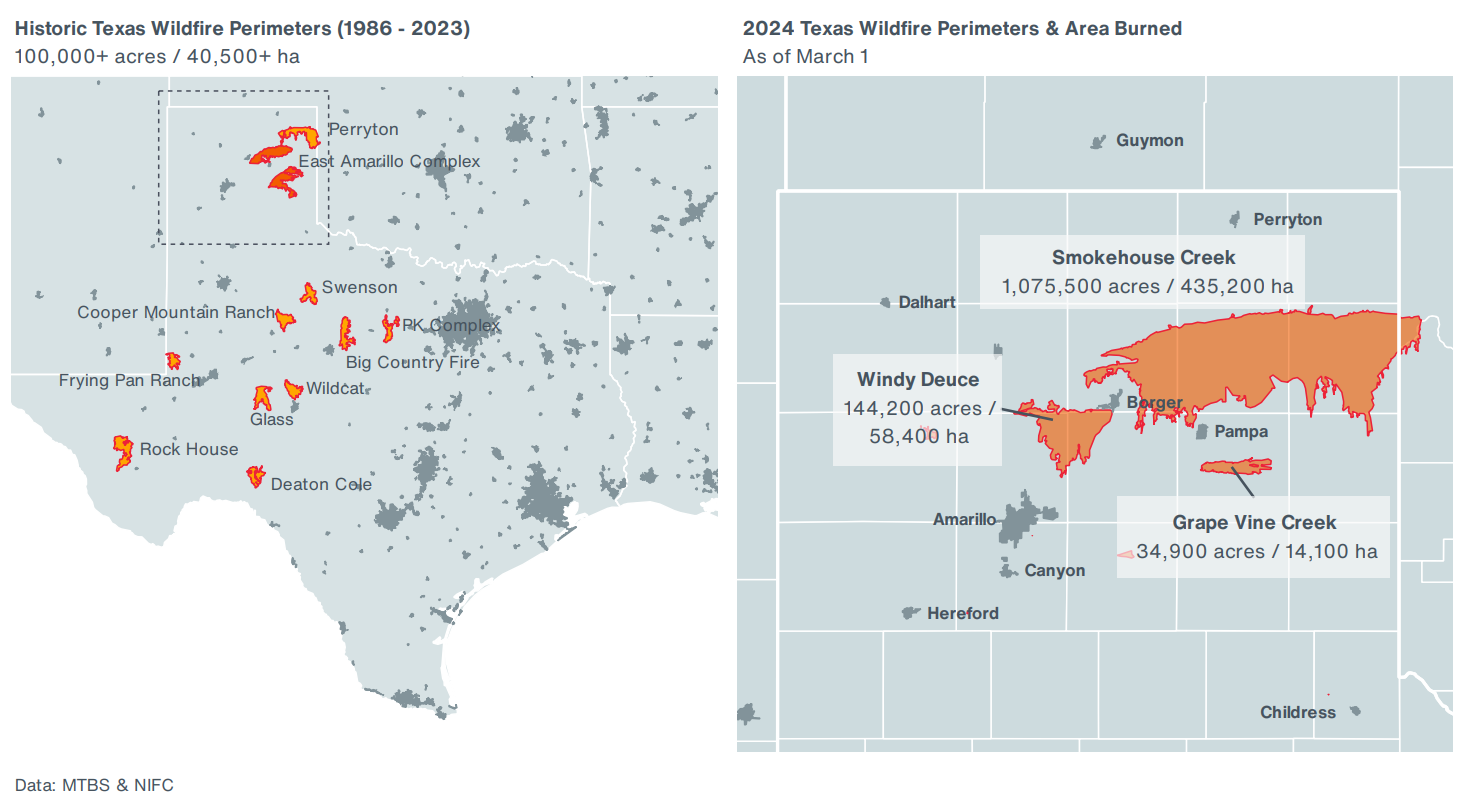
Notably, the U.S. has already seen more than triple the 10-year average of acres burned by wildfires thus far in 2024, according to the National Interagency Fire Center. This was primarily driven by heightened wildfire activity in Texas and Oklahoma in February and March, which led to the costliest Q1 insured loss total from wildfires on record. Nearly all of these losses solely came from the Smokehouse Creek Fire in Texas and western Oklahoma, where downed powerlines and high winds created the largest wildfire in the history of Texas. Two people were killed along with thousands of cattle, and as many as 500 structures were destroyed by the flames. This event alone stands significantly above the 21st -century wildfire Q1 insured loss average. In fact, the only comparable Q1 wildfire event in recent years is the 2022 Hatcher Mountain Road-Indigo Lane Fire in Tennessee that damaged more than 200 structures.
Historical Context
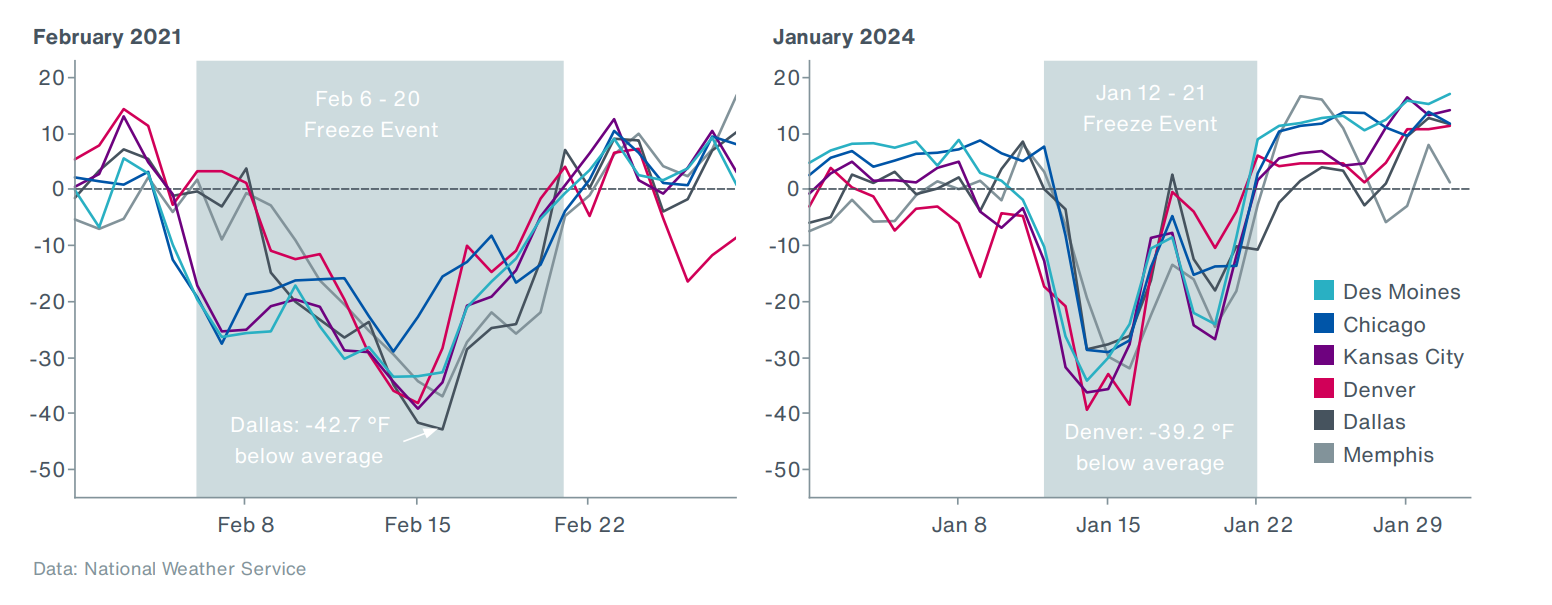
In mid-January of this year, deadly winter weather and a cold air outbreak over most of the lower 48 states resulted in over 70 deaths. This was one of the deadliest winter weather events in the U.S. in the 21st century – although well below the devastating deep freeze event in February 2021 where over 200 people died. Although both events saw prolonged, record-breaking cold air, the 2021 deep freeze featured colder temperatures over a longer period. This led to much greater impacts in 2021, including a widespread electric grid failure across Texas.
EXHIBIT 13: Daily Temperature Departure from Average (°F)
Chile Faced the Worst Disaster Since 2010
Overview
In February, a series of devastating wildfires aided by strong winds and prolonged heatwaves broke out in Central Chile, heavily V í O' bí Los Lagos. Wildfires claimed 131 lives and at least 1,100 injuries, and hundreds of people remain missing. Thousands of buildings were damaged, putting current estimated economic losses close to a billion USD, along with notable losses to the local insurance sector. Historical Context In Chile, the peak wildfire season typically begins in early December and lasts till April and the country faced severe wildfires in the past. The largest area of about 570,000 hectares (1.4 million acres) was burned during the season 2016/2017, according to the Chilean Forestry Corporation (CONAF).
EXHIBIT 14: Chile Wildfire Extent Since 1963/1964 Season (2023/2024 as of April 10)
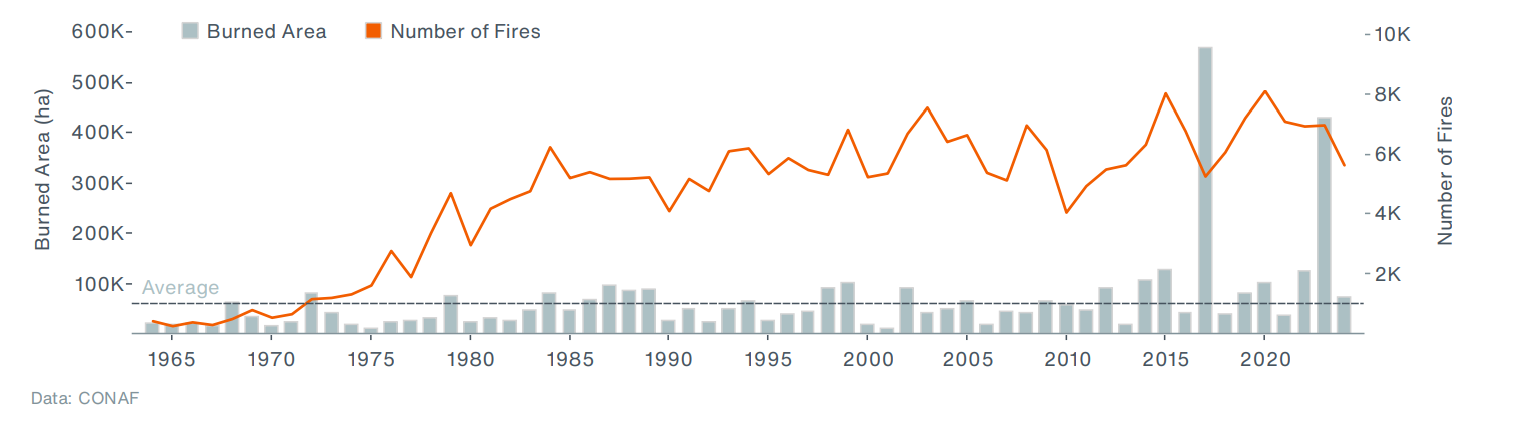
The ongoing wildfire season, which has already reached its peak, was not extraordinary in terms of total burned area and number of events compared to the previous extreme seasons that occurred in 2016/2017 and 2022/2023 (see Exhibit 14). However, as the wildfires affected populated areas, they impacted the highest number of structures and became the deadliest and one of the costliest in the country's history.
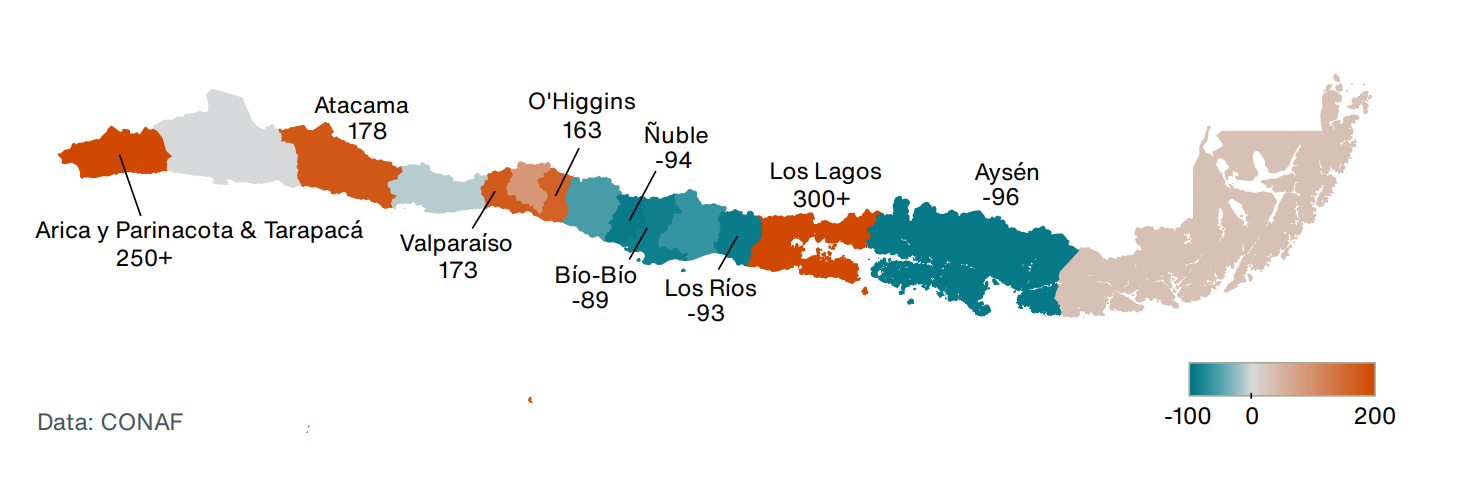
EXHIBIT 15: Ongoing Regional Wildfire Activity Compared to the Five-Year Average (%)
Damage Assessment
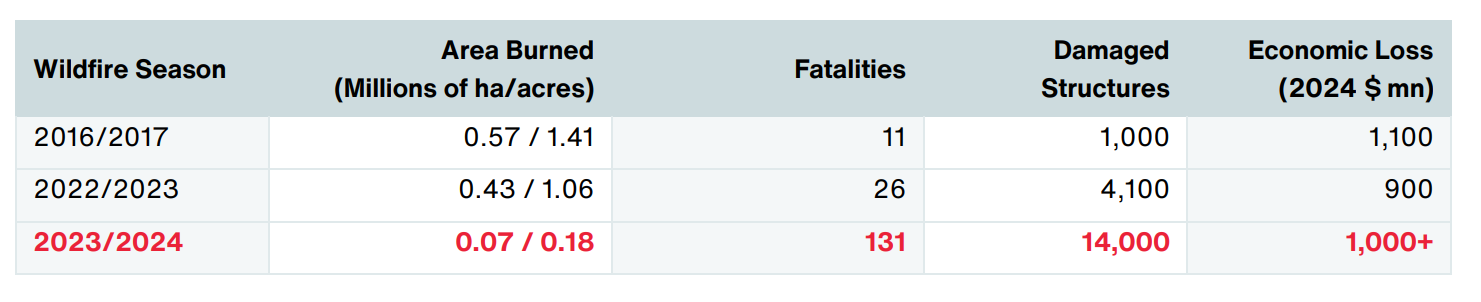
A state of emergency was declared on February 4 as fires moved from forested to urban areas, particularly the coastal cities of V ñ V í . The results of the damage assessment performed by the Copernicus Emergency Management Service3 indicated that 7,275 buildings were affected in the V í Region alone, from which 5,694 buildings were completely destroyed, 570 damaged, and 1,011 possibly damaged. This individual fire burned almost 2,000 hectares (4,950 acres) of land, including more than 600 hectares (1,500 acres) of urban areas. The V í Region bore the brunt of this disaster, with thousands of hectares of forests, businesses, universities, and homes destroyed, leading to significant human and structural losses. Countrywide, at least 14,000 houses were destroyed or damaged, according to the latest statement of the Deputy Interior Minister. A total economic loss is tentatively estimated to exceed one billion USD. According to data compiled by the Financial Markets Commission of Chile (CMF) as of March 8 4 , 1,268 insurance claims were filed. Property policies constituted 54 percent of all claims, while auto claims accounted for about 31 percent, with the majority being fi V ñ Insured losses are expected to surpass $120 million in the hardest-hit municipalities of V ñ , V í , Villa Alemana and Limache.
EXHIBIT 16: Notable Wildfire Seasons in Chile
Lessons to be Learned from Recent Damaging Events
Since the devastating wildfires in 2017, an intense discussion on the country' to such extreme wildfire events has been taking place5 . However, suggested changes take a long time to implement. This might be one of the reasons why the 2022/2023 wildfire season appeared similarly severe as 2017. Some experts urge the need for a review of the regulation of the forestry sector, which should result in more resilient tree plantations. As of today, Chilean forest plantations do not face environmental evaluation processes and their commitments to prevent fires are not regulated or supervised. Therefore, most of these plantations do not follow recommended methods, such as building firebreaks or cultivating more heterogeneous and multifunctional landscapes. Moreover, there is no mechanism to ask owners for compensation or pay charges in case of a damaging event. Given the great impact of fires in the wildland-urban interface (contact zones between vegetation and human infrastructure), increased management and regulations are necessary in this area, in order to achieve wider implementation of technical protocols for fuel reduction. Regulatory aspects associated with urban expansion and parceling should be defined as well. The transformation of the National Forestry Corporation (CONAF) into an organization that comprehensively supervises and cares for Chilean forests, not dedicating itself only to fire attacks, is one of the promising steps for a more resilient future.
Extremely Active Hurricane Season Forecast for 2024
Record-breaking Land And Ocean Temperatures Driven by El Niño
Historic and record-setting high air temperatures were observed in several regions of the world during Q1, often further exacerbating drought conditions and wildfire development in different regions. South America and Africa had their warmest and second-warmest January-March period on record. Parts of Australia were also severely affected by prolonged heatwaves with many temperature records, marking the country' third-warmest summer on record. Other locations experienced substantial above-average temperatures during their winter period, including the United States, and much of Europe. North America had its warmest winter on record, and Europe saw the second-warmest winter, particularly driven by extreme monthly temperature anomalies reaching up to 7˚C (12.6˚ in February. According to NOAA, all three months from January to March ranked as the warmest for the globe dating to 1850. March 2024 became the 10th consecutive warmest month globally. Global ocean surface temperature was also well above the long-term average, hitting a monthly record high for the 12th consecutive month after March. Northern Hemisphere Ocean temperature contributed significantly to these anomalies and the warm ñ ENSO ( ñ -Southern Oscillation) phase is expected to play a critical role in further global temperature increase. High ocean temperature anomalies are often seen in months with prevailing ñ conditions, as seen in Exhibit 17 (selected periods highlighted in squares).
Exhibit 17: Monthly ENSO Phase And Northern Hemisphere Ocean Temperature Anomaly (˚C)
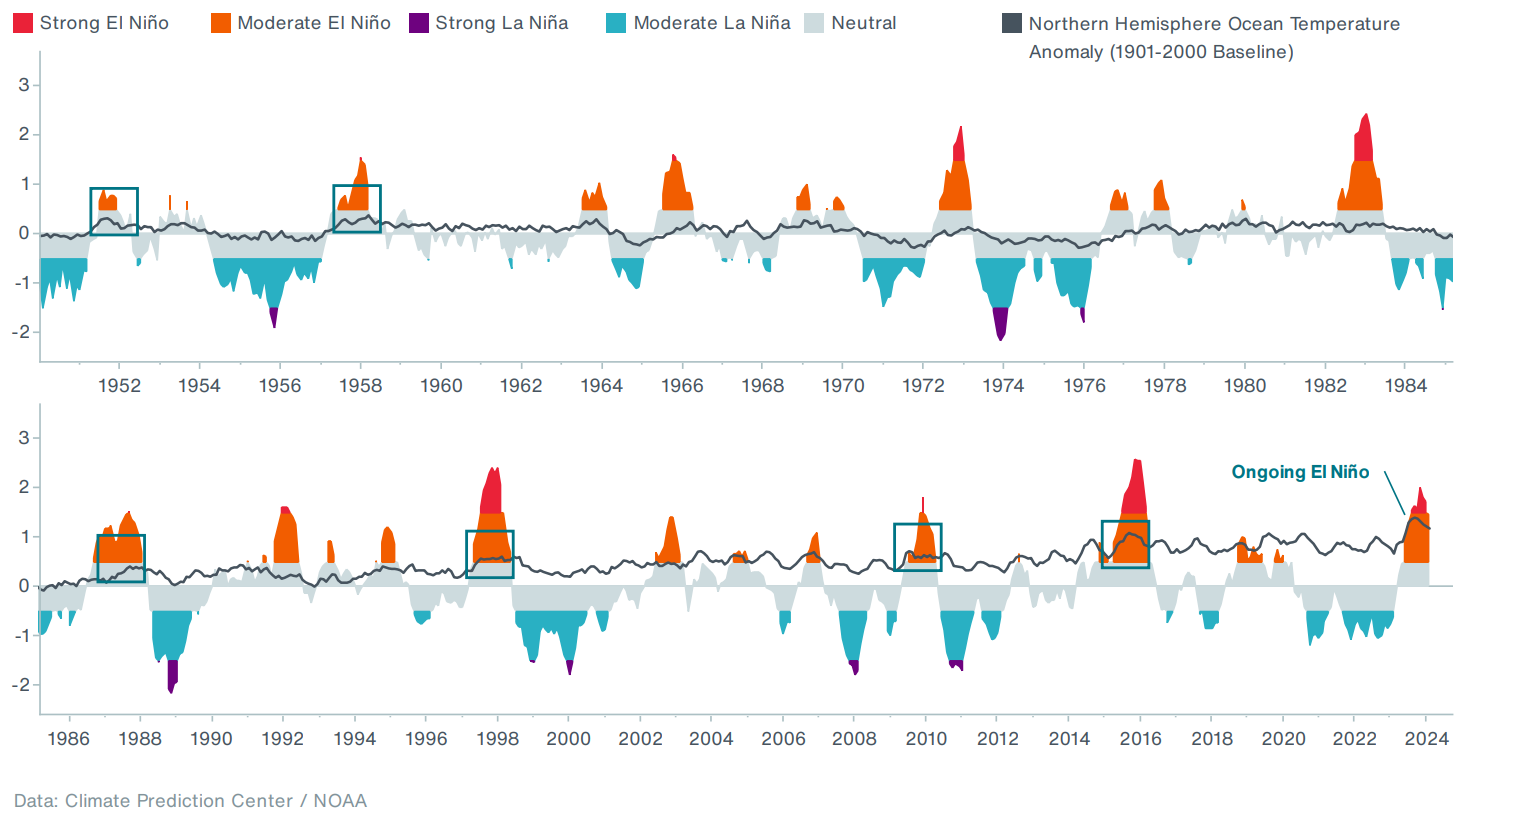
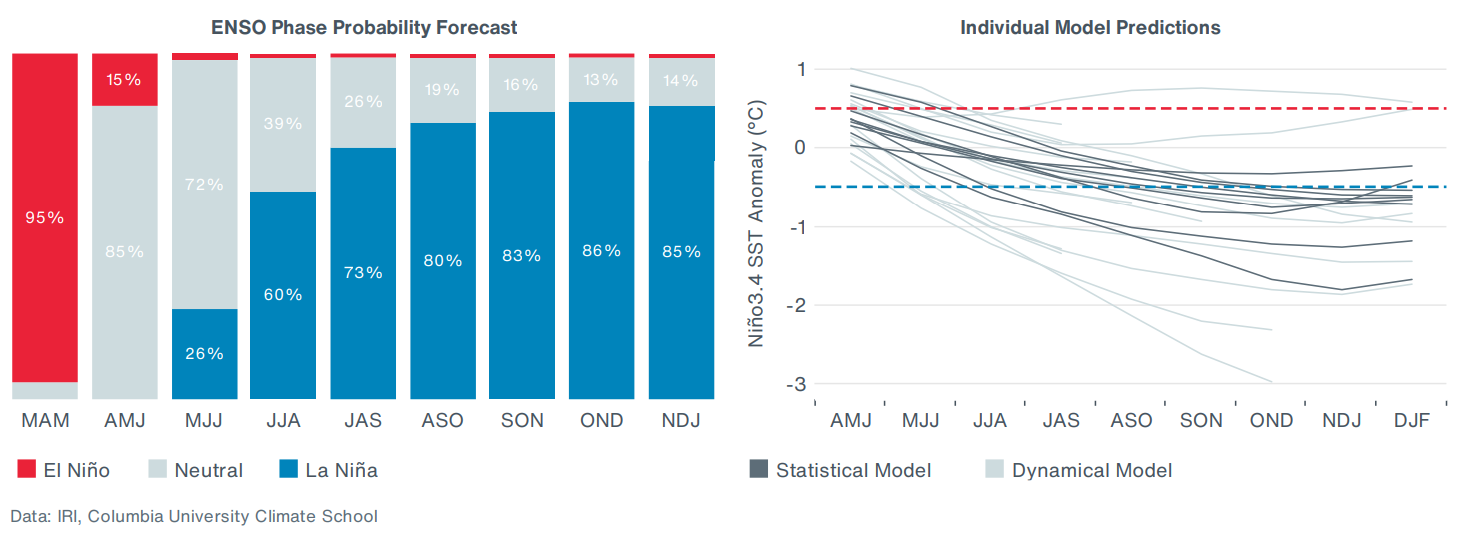
However, according to the latest ENSO model projections (Exhibit 18), the ENSO cycle is increasingly likely to switch from warm E ñ conditions to a ñ later this year.
Exhibit 18: Latest Probabilistic ENSO Model Projections
Possible La Niña Implications
The timing of a shift to La Nina conditions is seen as one of the critical factors for the 2024 hurricane season, as it could make conditions more conducive to storm formation and reduce the wind shear, which hinders tropical storm development.
Exhibit 19: Typical La Niña Teleconnections
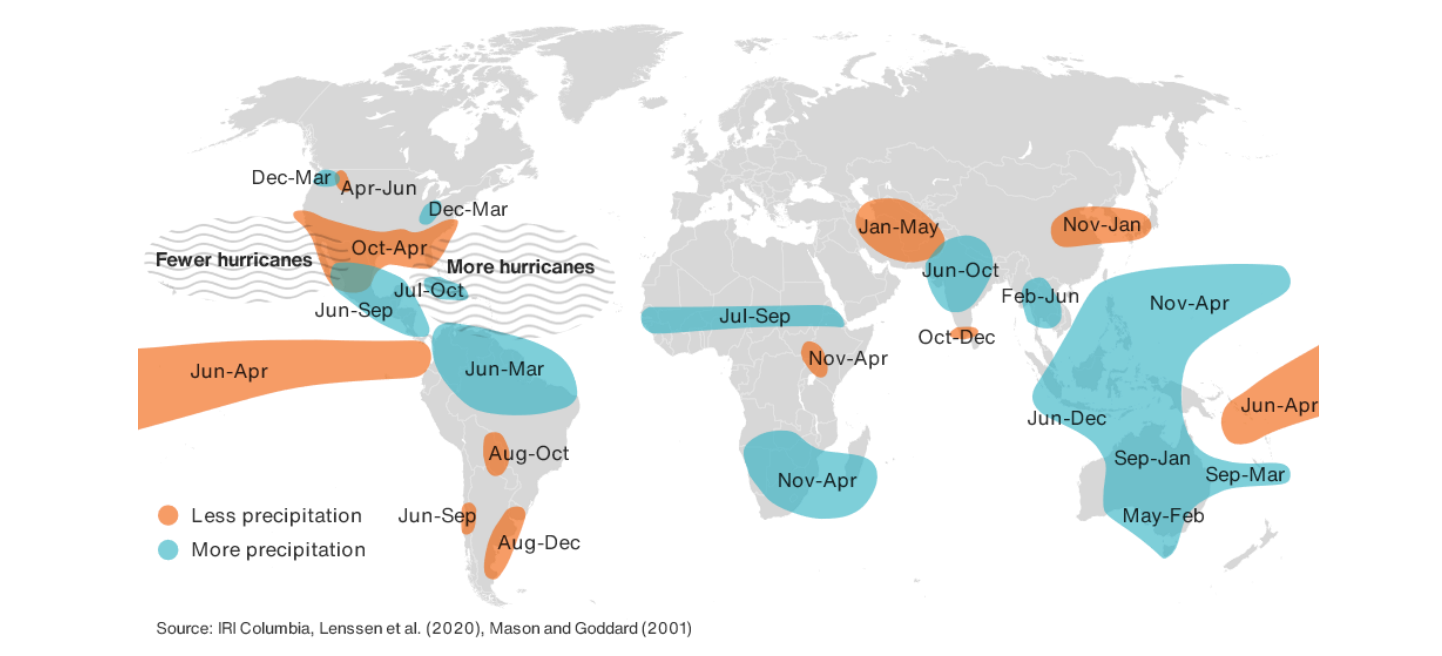
Above-average sea surface temperatures (SST) that have already been seen might be another key factor for the upcoming hurricane season, as warm seawater enhances favorable conditions for tropical cyclone formation and intensification. Sea surface temperatures are now already at levels typical for June and July in parts of the Atlantic. La Niña conditions are also known to shift rainfall patterns in many different parts of the world. The regions and seasons shown in Exhibit 19 indicate typical (but not guaranteed) impacts of La Niña
Hurricane Seasonal Forecasts
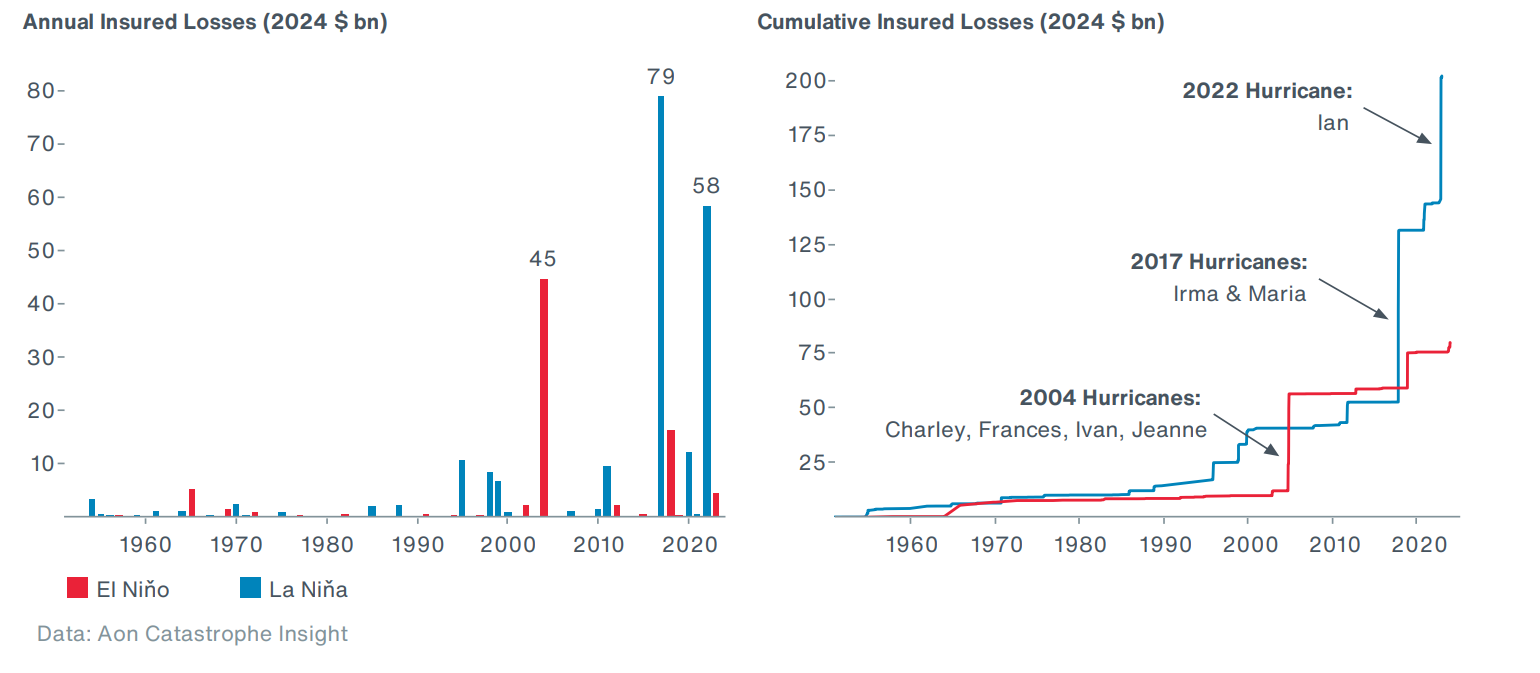
Several groups and organizations have released their long-range forecasts for the upcoming North Atlantic Hurricane season. All of these predictions suggest that 2024 could be very active, with an average number of expected hurricanes at 11. Some of the forecasts we b " " Please note that the selected forecasts listed here include a number of storms that are expected to develop within the Atlantic Ocean basin and not all of them will make landfall. Exhibit 21 below summarizes the insured losses resulting from the tropical cyclones in the U.S. and the Americas, shown by ENSO phases during a given hurricane season (excluding losses during the neutral ENSO phase). Insurers faced notable hurricane-related losses in 2017 and 2022, which occurred in ñ , in the similar ñ 3.4 SST anomalies that are projected to be seen during the upcoming hurricane season. Based on ' Catastrophe Insight data, hurricanes have caused insured losses of more than $200 billion during ñ conditions since 1950, while significantly lower losses ($80 billion) have been incurred in El ño phases.
Exhibit 20: 2024 Selected Hurricane Season Forecasts
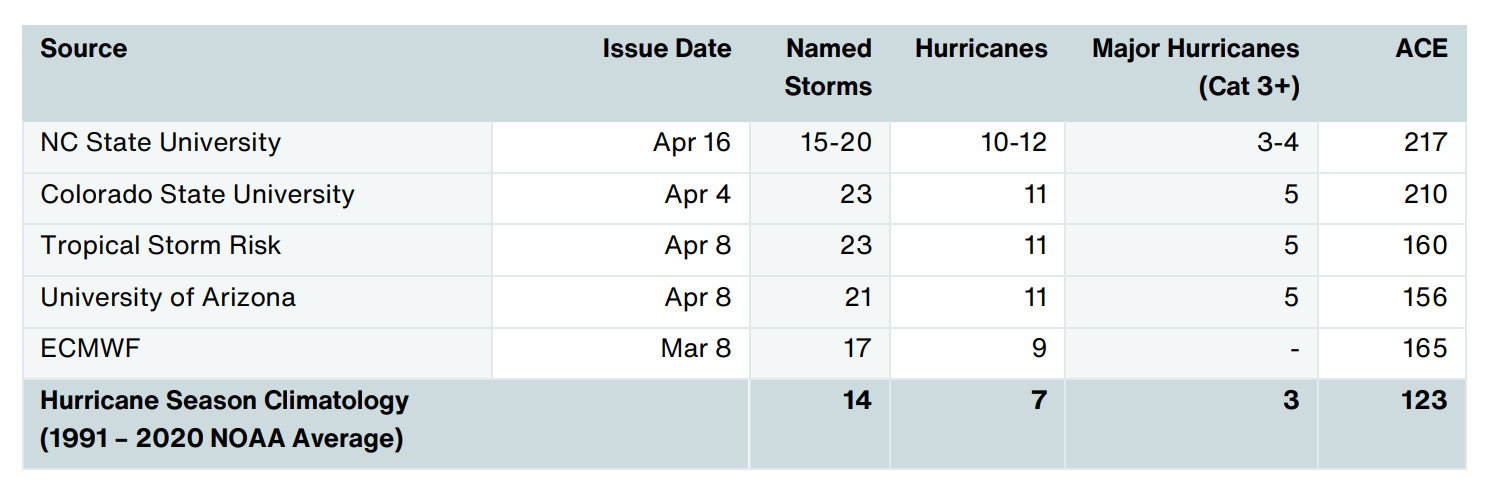
Exhibit 21: U.S. & Americas Tropical Cyclone Insured Losses by ENSO Phase
Appendix: Q1 2024 Data
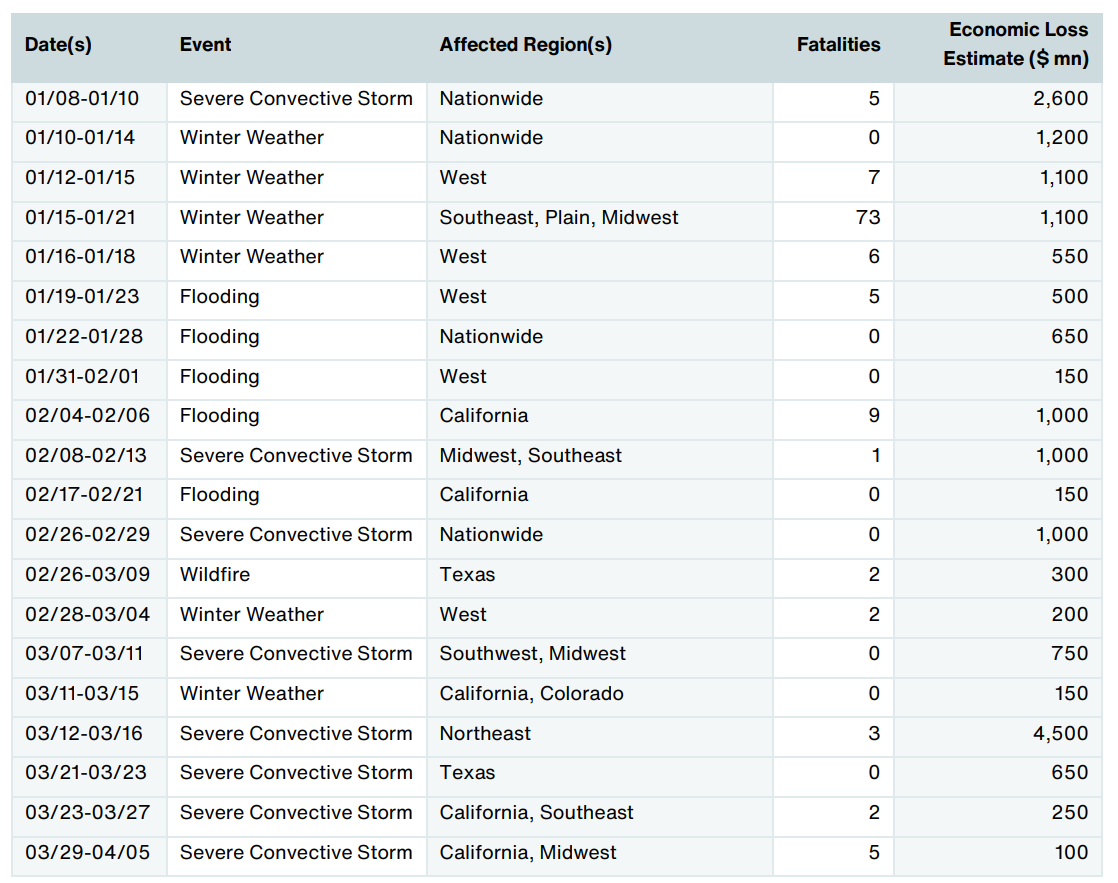
United States
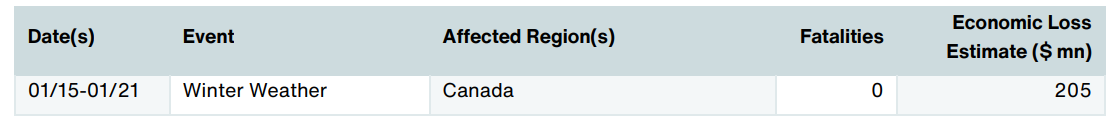
North America (Non-U.S.)
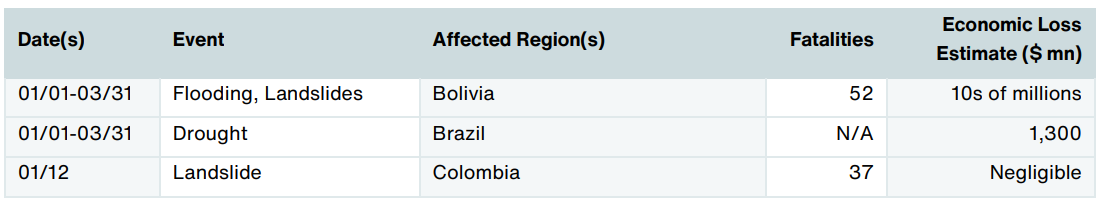
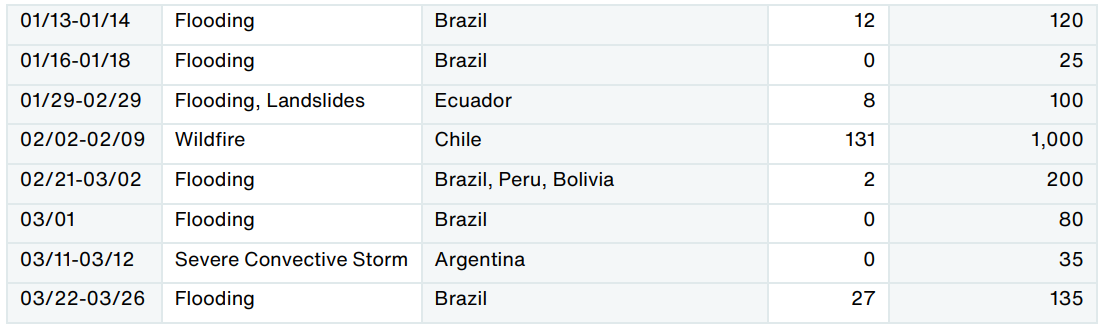
South America
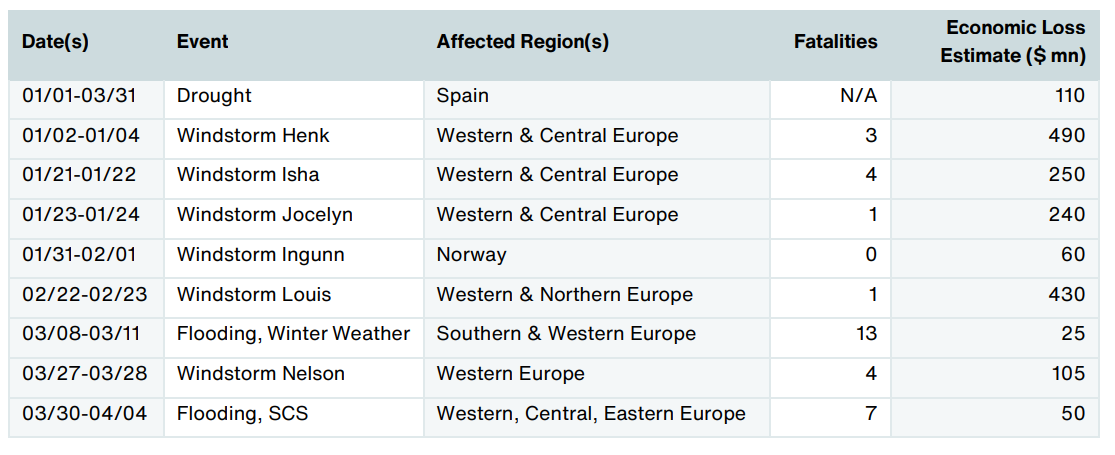
Europe
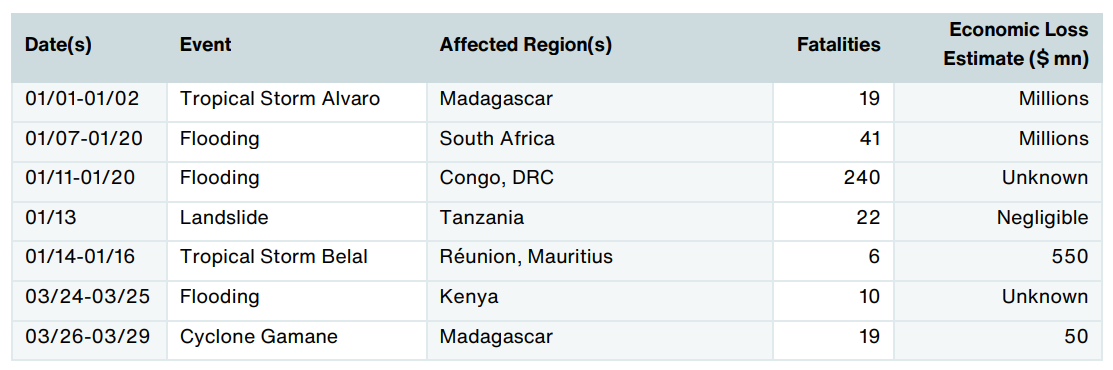
Africa
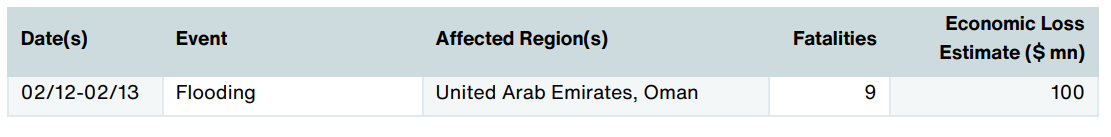
Middle East
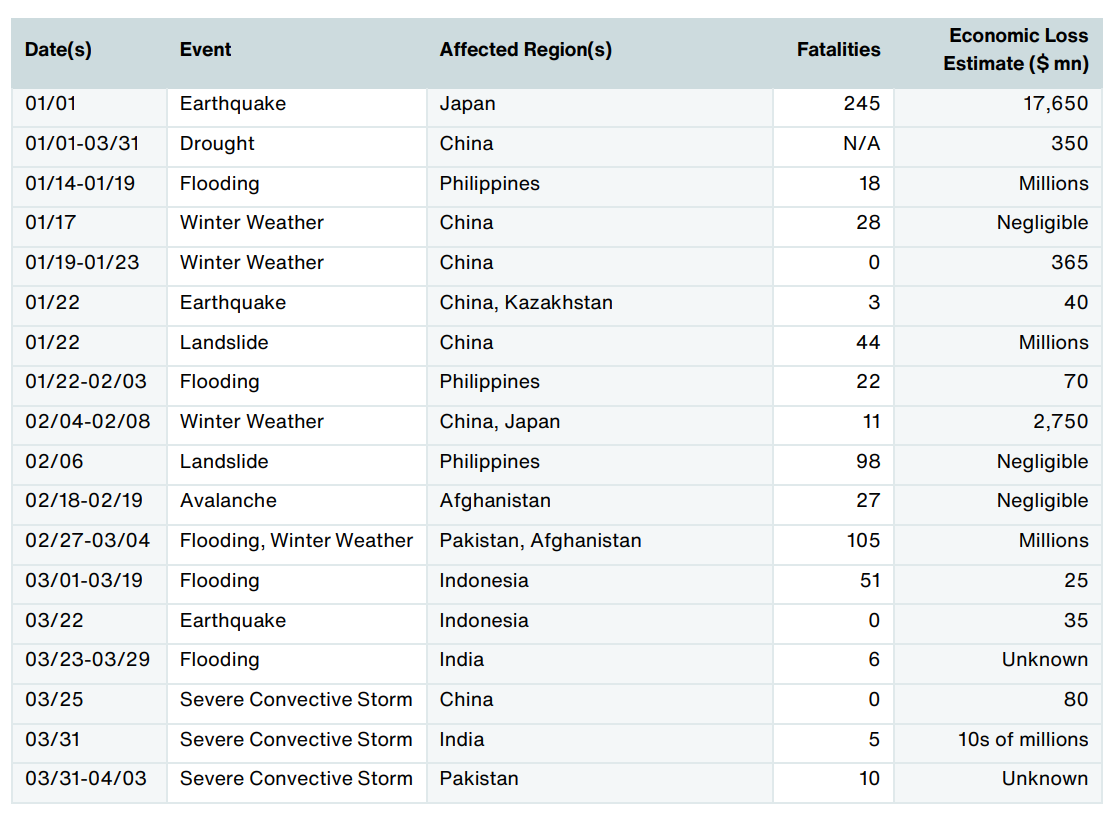
Asia
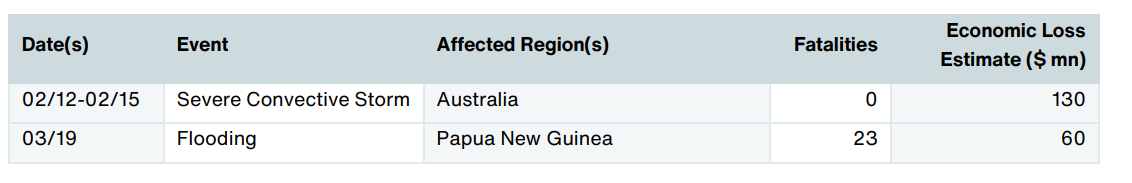
Oceania
Source : https://www.aon.com/reinsurance/thoughtleadership/default/global-catastrophe-recap-q1-2024